Colors and Fills
Nytril gives you full control over colors and fill patterns with lines, shapes and
text. Use a color palette and different fill gradients to make colorful and
informative documents.
View on YouTube
Colors namespace
The
Colors
namespace contains a variety of commonly used solid colors for lines and text.
Headline
=
Paragraph
{
TextHeight
:
200%;
TextFamily
:
TextFamilies
.
TimesNewRoman
;
TextColor
:
Colors
.
Green
;
Icons
.
rocket
;
Bold
;
" Aliens Finally Land!"
;
};
Aliens Finally Land!
Colors Palette
Use a loop to build a palette with each color in the
Colors
namespace .
ShowColors
=
Paragraph
{
foreach
(
var
c
in
Colors
)
{
Canvas
(
BoxSize
,
BoxSize
) {
Background
:
c
;
Tip
:
c
;
};
}
};
Chart Colors
For applications where contrasting colors are needed, get the bar colors used in charts with the
ChartColor
function.
ChartColors
=
HBox
{
Separation
:
8;
for
(
int
i
=
1;
i
<
20;
++
i
) {
HBox
(
BoxSize
,
BoxSize
) {
Background
:
Color
.
ChartColor
(
i
);
}
}
};
RGBA Values
The
Color
constructor initializes a color with a specific RGBA value.
ShowColor
(
Color
color
)
=
Span
{
Canvas
(
BoxSize
,
BoxSize
) {
Background
:
color
;
Baseline
:
80%;
};
Space
;
Span
{
Separator
:
CommaSpace
;
TextRadix
:
16;
TextNumPadding
:
2;
color
.
R
;
color
.
G
;
color
.
B
;
color
.
A
;
};
};
ColorConstructor
=
ShowColor
(
new
Color
(0x3F, 0x80, 0xFF, 0xFF)
);
3f, 80, ff, ff
Color Values in Source
The same color can be specified directly in source code using the #rrggbbaa# color notation.
ColorSource
=
Span
{
ShowColor
(
#3F80FFFF#
);
};
3f, 80, ff, ff
HSLA Values
Colors can also be constructed from hue-saturation-lightness-alpha values with the
FromHSLA
function.
ShowHSLA
=
HBox
{
var
color
=
Color
.
FromHSLA
(170, 0.25, 0.5);
Separation
:
3;
VAlign
:
Center
;
Canvas
(
BoxSize
,
BoxSize
) {
Background
:
color
;
};
Paragraph
{
TextDigits
:
2;
Separator
:
Space
*
3;
color
.
H
;
color
.
S
;
color
.
L
;
color
.
A
;
};
};
170.00 0.25 0.50 255.00
Alpha Blends
Set the alpha value of a color to less than 1 to mix overlayed colors.
AlphaBlend
=
Canvas
{
Span
{
"Text"
;
TextHeight
:
W
*
2;
TextColor
:
#00004560#
};
Canvas
(
W
,
W
) {
X
:
W
;
Y
:
W
;
Background
:
#00640080#
;
};
Canvas
(
W
,
W
) {
X
:
W
*
0.5;
Y
:
W
*
0.5;
Background
:
#64000060#
;
};
};
Text
Blended colors
Linear Gradient
Use a
LinearGradient
to create a fill pattern that shifts smoothly from one color to the next.
ShowShapes
(
name
,
fill
)
=
HBox
{
VAlign
:
Center
;
Separation
:
sh
;
Margin
:
PadB
(
sh
*
0.5);
HBox
(
sh
*
6) {
TextHeight
:
sh
;
name
};
Shape
(
fill
) {
EllipsePath
(
new
(
new
(0),
new
(
hm
,
hm
)))};
Canvas
(
hm
,
hm
) {
Background
:
fill
};
Shape
(
fill
) {
OpenPath
(0) {
LineTo
(
hm
,
hm
);
LineTo
(
hm
*
2,
hm
*
0.5);
LineTo
(
hm
*
3,
hm
);
LineTo
(
hm
*
4, 0)};
};
};
readonly
ColorStop
[]
ColorStops
=
[
new
(10%,
Colors
.
Orange
),
new
(25%,
Colors
.
Blue
),
new
(50%,
Colors
.
Red
),
new
(80%,
Colors
.
Green
)
];
FillLinearGradient
=
Block
{
ShowShapes
(
"Linear"
,
new
LinearGradient
(0, 0, 0, 1,
ColorStops
));
};
Linear
Gradient Direction
Use the points in the constructor to define the direction of the gradient.
FillLinearGradients
=
Block
{
ShowShapes
(
"Vertical"
,
new
LinearGradient
(
0, 0, 0, 1
,
ColorStops
));
ShowShapes
(
"Horizontal"
,
new
LinearGradient
(0, 0, 1, 0,
ColorStops
));
ShowShapes
(
"Diagonal"
,
new
LinearGradient
(0, 0, 1, 1,
ColorStops
));
};
Vertical
Horizontal
Diagonal
Radial Gradient
Use
RadialGradient
to create a fill pattern that radiates from a central point.
FillRadialGradient
=
Block
{
ShowShapes
(
"Radial"
,
new
RadialGradient
(0, 0, 0, 0, 1, 1,
ColorStops
));
};
Radial
Radial Gradient
Use the points in the constructor to define the center, focus and radius of the gradient.
FillRadialGradients
=
Block
{
ShowShapes
(
"Top Left"
,
new
RadialGradient
(
0, 0, 0, 0, 1, 1
,
ColorStops
));
ShowShapes
(
"Top Right"
,
new
RadialGradient
(1, 0, 1, 0, 1, 1,
ColorStops
));
ShowShapes
(
"Centered"
,
new
RadialGradient
(0.5, 0.5, 0.5, 0.5, 1, 1,
ColorStops
));
ShowShapes
(
"Bottom Left"
,
new
RadialGradient
(0, 1, 0, 1, 1, 1,
ColorStops
));
ShowShapes
(
"Bottom Right"
,
new
RadialGradient
(1, 1, 1, 1, 1, 1,
ColorStops
));
};
Top Left
Top Right
Centered
Bottom Left
Bottom Right
Heat Gradient
An even color spectrum can be formed from an array of colors with the
FromColorArray
function.
readonly
Heat
=
LinearGradient
.
FromColorArray
([
Colors
.
Blue
,
Colors
.
Cyan
,
Colors
.
Yellow
,
Colors
.
Red
]);
ShowHeatmap
=
HBox
(
BoxSize
*
20,
BoxSize
) {
Background
:
Heat
;
};
Interpolated Colors
An interpolated color can be computed using a color gradient with the
InterpolateColor
function.
Interpolation
=
HBox
{
for
(
double
i
=
0;
i
<=
1.0;
i
+=
0.04) {
HBox
(
BoxSize
,
BoxSize
,
BorderR
(
new
(1, 0, 89%))) {
Background
:
Heat
.
InterpolateColor
(
i
);
}
}
};
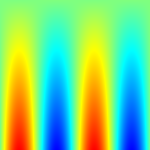
Heat Map
A 2-dimensional color image can be created from the values in a matrix with the
GetImage
function.
Color
HeatColor
(
int
_
,
int
_1
,
double
value
)
=
Heat
.
InterpolateColor(
value
);
GetMapImage
=
Span
{
int
size
=
150;
var
m
=
new
Matrix
<
double
>
(
size
,
size
, 0);
for
(
int
i
=
0;
i
<
size
;
++
i
) {
for
(
int
j
=
0;
j
<
size
;
++
j
)
m
[
i
,
j
]
=
0.5
+
0.5
/
size
*
i
*
Math
.
Sin
(
j
*
2.0
*
Math
.
PI2
/
size
);
}
var
image
=
m
.
GetImage
(
@
HeatColor
,
"Sinusoidal Heat Map"
);
FitBox
(
image
,
BoxSize
*
10);
};
Sinusoidal Heat Map